Back to Blog
How to use your employee engagement survey results
The survey results are in. The data is in front of you. Next is the tricky bit: utilizing that data to benefit your organization. We laid out the five steps you should take next:
- Analyze and interpret results
- Present your data with a report
- Respond to your employees’ input
- Create an employee engagement action plan
- Schedule further feedback
We’ll guide you through each step below.
Step 1: Analyze and interpret the results
If you’re not a data enthusiast, working out what to do with your employee engagement survey results can be overwhelming. Ideally, we’d recommend using online employee engagement solutions to collect and analyze your data for you. But since you’re here, we’re guessing you’ve already got the data to work with. Here’s what to do with it:
- Quantify the data - This means turning your results into measurable and comparable data (learn more about types of data here)..
- Segment your data - Different teams will have different experiences, so you must be able to look at employee engagement by departments and demographics. Cross sections to consider include age, department, gender, ethnicity, job commitment (full-time, part-time, contractor), office location, and salary.
- Identify patterns and trends - What patterns can you spot within your results? Are leaders more engaged than lower-level employees? Is a specific team showing discontent with the tasks they’re assigned? The only way to take appropriate action is to identify the trends that need addressing.
- Work out overall engagement rate - How to calculate your overall employee engagement rate will depend on the questions you’ve asked in your survey. This article from Kona provides more details and equations to use.
- Check benchmarks - If you’ve completed employee engagement survey results analysis before, revisit your benchmarks and see how things look compared to historical data. What other trends do you notice? Consider that results can reflect seasonality and compare like for like. Ie, don’t compare engagement during a summer period with a previous winter.
- Read the comments and try sentiment analysis - Look closely at personal comments to find patterns (issues or successes brought up often) and explain negative/positive trends. E.g. productivity scores are low, and comments repeatedly say teams are experiencing frequent technical difficulties. You can also try using sentiment analysis software to help gather an overall understanding of what’s being said.
- Don’t take responses personally - Keep an open mind and remember that the results you discover are an opportunity to develop. While reviewing data, look to understand why people might feel this way rather than seeking to find out exactly ‘who said what’.
To compare how your organization is fairing regarding wider employee engagement, look at this article on 2022/2023 employee engagement statistics.
Step 2: Present your data with a report
Figuring out how to present employee satisfaction survey results in a way all stakeholders can understand is crucial to using your data company-wide. A thorough report should look to
- Position the survey - Explain why it was conducted and what you hoped to learn.
- Note respondent demographic - What percentage of employees responded to your survey (the response rate), and what demographics were they from (see ‘segmenting data’ above).
- Overall engagement - Using your results, start the report presenting overall employee engagement rates.
- Breakdown top strengths & weaknesses - Next present the key takeaways from your results. Which areas of your employee experience are thriving and where are employees reporting most discontent?
- Summarize changes - This is where to show your latest data against company benchmarks. How are things looking since your last survey?
- Bring in comments - Here’s where to show specific feedback or share your sentiment analysis.
As you’re creating a report, keep a few things in mind:
- Be as objective as possible - Your role is that of a scientist, researching engagement and sharing insights to improve the business.
- Less is more - Share the findings that matter most (good or bad) and dive deeper into those. If someone asks for more data, consider providing the dataset or an appendix with more information.
-
Take a look at this example employee engagement survey report from Custom Insight to get an idea of what this might look like.

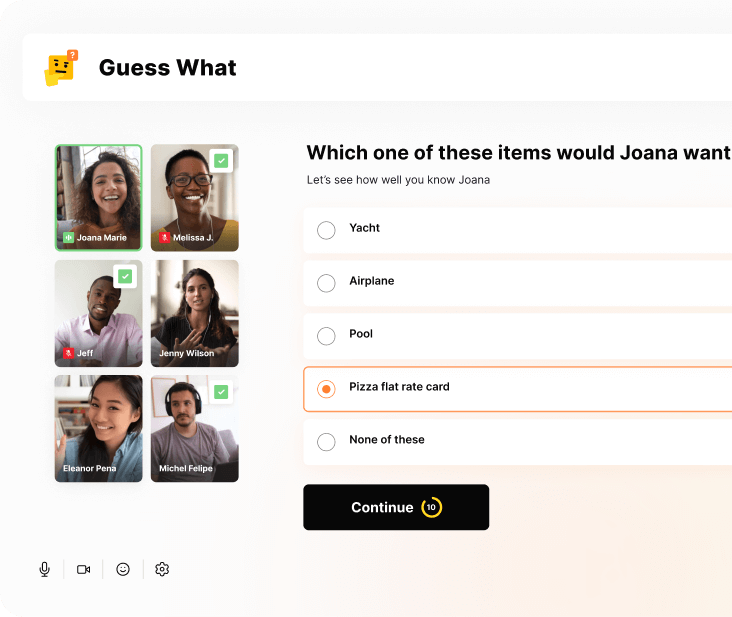
Share fun facts and bond with a team quiz
Have your participants choose from a list of questions they’d like their coworkers to answer about them, before watching as they guess the right answer.
01. Yes
share-fun-facts-and-bond-with-a-team-quiz
Run a guided recognition activity
Have your participants choose from a list of questions they’d like their coworkers to answer about them, before watching as they guess the right answer.
01. Yes
run-a-guided-recognition-activity
Organize a virtual cooking class
Hire a professional chef to help your team cook a delicious lunch or dinner. May be difficult for co-workers with families. To find providers and get tips, read our blog about virtual cooking classes.
02. No
organize-a-virtual-cooking-class

Hire a stand-up comedian
Have your participants choose from a list of questions they’d like their coworkers to answer about them, before watching as they guess the right answer.
02. No
hire-a-stand-up-comedian

No items found
No items found
Table of contents
The survey results are in. The data is in front of you. Next is the tricky bit: utilizing that data to benefit your organization. We laid out the five steps you should take next:
- Analyze and interpret results
- Present your data with a report
- Respond to your employees’ input
- Create an employee engagement action plan
- Schedule further feedback
We’ll guide you through each step below.
Step 1: Analyze and interpret the results
If you’re not a data enthusiast, working out what to do with your employee engagement survey results can be overwhelming. Ideally, we’d recommend using online employee engagement solutions to collect and analyze your data for you. But since you’re here, we’re guessing you’ve already got the data to work with. Here’s what to do with it:
- Quantify the data - This means turning your results into measurable and comparable data (learn more about types of data here)..
- Segment your data - Different teams will have different experiences, so you must be able to look at employee engagement by departments and demographics. Cross sections to consider include age, department, gender, ethnicity, job commitment (full-time, part-time, contractor), office location, and salary.
- Identify patterns and trends - What patterns can you spot within your results? Are leaders more engaged than lower-level employees? Is a specific team showing discontent with the tasks they’re assigned? The only way to take appropriate action is to identify the trends that need addressing.
- Work out overall engagement rate - How to calculate your overall employee engagement rate will depend on the questions you’ve asked in your survey. This article from Kona provides more details and equations to use.
- Check benchmarks - If you’ve completed employee engagement survey results analysis before, revisit your benchmarks and see how things look compared to historical data. What other trends do you notice? Consider that results can reflect seasonality and compare like for like. Ie, don’t compare engagement during a summer period with a previous winter.
- Read the comments and try sentiment analysis - Look closely at personal comments to find patterns (issues or successes brought up often) and explain negative/positive trends. E.g. productivity scores are low, and comments repeatedly say teams are experiencing frequent technical difficulties. You can also try using sentiment analysis software to help gather an overall understanding of what’s being said.
- Don’t take responses personally - Keep an open mind and remember that the results you discover are an opportunity to develop. While reviewing data, look to understand why people might feel this way rather than seeking to find out exactly ‘who said what’.
To compare how your organization is fairing regarding wider employee engagement, look at this article on 2022/2023 employee engagement statistics.
Step 2: Present your data with a report
Figuring out how to present employee satisfaction survey results in a way all stakeholders can understand is crucial to using your data company-wide. A thorough report should look to
- Position the survey - Explain why it was conducted and what you hoped to learn.
- Note respondent demographic - What percentage of employees responded to your survey (the response rate), and what demographics were they from (see ‘segmenting data’ above).
- Overall engagement - Using your results, start the report presenting overall employee engagement rates.
- Breakdown top strengths & weaknesses - Next present the key takeaways from your results. Which areas of your employee experience are thriving and where are employees reporting most discontent?
- Summarize changes - This is where to show your latest data against company benchmarks. How are things looking since your last survey?
- Bring in comments - Here’s where to show specific feedback or share your sentiment analysis.
As you’re creating a report, keep a few things in mind:
- Be as objective as possible - Your role is that of a scientist, researching engagement and sharing insights to improve the business.
- Less is more - Share the findings that matter most (good or bad) and dive deeper into those. If someone asks for more data, consider providing the dataset or an appendix with more information.
-
Take a look at this example employee engagement survey report from Custom Insight to get an idea of what this might look like.
Step 3: Respond to your employee's input
Next, it’s time to respond to your employee’s survey input. Your survey report will help employees gauge where their colleague's sentiment lies, which is always valuable. However, there’s more to be done than emailing everyone a doc. Here’s what to keep in mind:
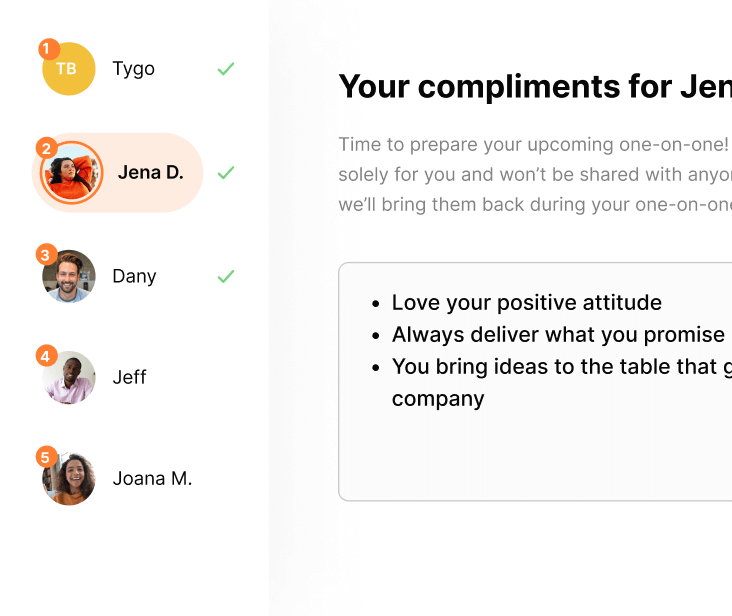
- Make people feel heard - Think about how you can ensure your employees know they’re truly being listened to. Would a particular team benefit from scheduling in 1-1 conversations to have their opinions known in more depth? Make it a priority to carry out an employee engagement survey follow up and show employees you have a plan of action.
- Don’t argue, listen - In the same vein, try not to get defensive about the results. Use this as an opportunity to learn, and trust your employees - they know what they need.
- Can’t offer a solution? Show you value their input anyway - If you can’t find a solution to the problems flagged within your employee engagement survey, think about how you can compromise. Show your employees their input was taken seriously. Can you set a date to revisit a potential solution? Give this one a read for more on why recognition is key to employee engagement.
- Share results in multiple ways - Sending out the report via email is great, but it shouldn’t be the only platform to communicate your findings. Use a mix of communications: company newsletters, your intranet homepage, webinar/focus groups, team meetings, manager cascades, and infographic posters.
Step 4: Create an employee engagement action plan
The results of your employee engagement survey are meaningless without action. The next step is to create an action plan you and your teams can refer to as you strive to make positive changes and increase employee engagement.
An effective action plan looks at the key weaknesses within your employee experience and provides a few steps to address each of these areas.
See our guide on how to create an employee engagement survey action plan (with ready-to-go action play templates) for further support. Will team building be on your action plan? Good news, we’ve got plenty of ideas on team building for work and team building activities for virtual teams.
Step 5: Schedule further feedback
Whether it’s putting a date in for the next in-depth survey or planning pulse surveys to check in on employee contentment in the following months. Plan further feedback opportunities now to keep employee engagement a priority.
Plus, consider any other areas of feedback that need further investigation while you’re at it. For example, would an employee satisfaction survey give more insight? You can find out the difference between employee engagement and employee satisfaction here.
Improving future employee engagement surveys
Not confident in the quality of survey responses you’ve received? Or realize you’ve missed key questions to shape your next steps? Note how you can improve future employee engagement survey results now.
We recommend giving these articles a read for more specific support on choosing platforms to support you:
- A quick-fire guide to employee engagement measurement
- The absolute best employee engagement apps
- Our top virtual employee engagement platforms of 2022/2023
Looking for more ideas on how you can improve the engagement of your teams? We’ve got it covered:
Have a blast with your remote team 🔥
Our team building activities are rated 9/10 by over 900 remote teams.
It's the easiest way to feel close when working remotely!


Related articles
.jpg)

.jpg)
Subscribe to get our latest updates
Subscribe to get our latest updates